Which are the main trade industries? Who are the top economies in the world? Electronics, mineral fuels & oils, pharma, vehicles, and pearls and precious stones are the biggest sectors. China and the United States of America are the top economies in the world. India is emerging as a growing economy due to foreign investment in the country and local manufacturing of commodities. Here is an overall outlook of global industries and import-export countries.
World’s Major Import Categories
Global imports totaled USD 25.4 trillion in 2022, and that dollar amount declined to USD 23.5 trillion in 2023.


The world’s major import categories include electrical machinery and equipment, mineral fuels and oils, machinery, mechanical appliances, nuclear reactors, etc., vehicles other than railway or tramway, and pharmaceutical products.
See the top import categories in 2022 and 2023 with their values.
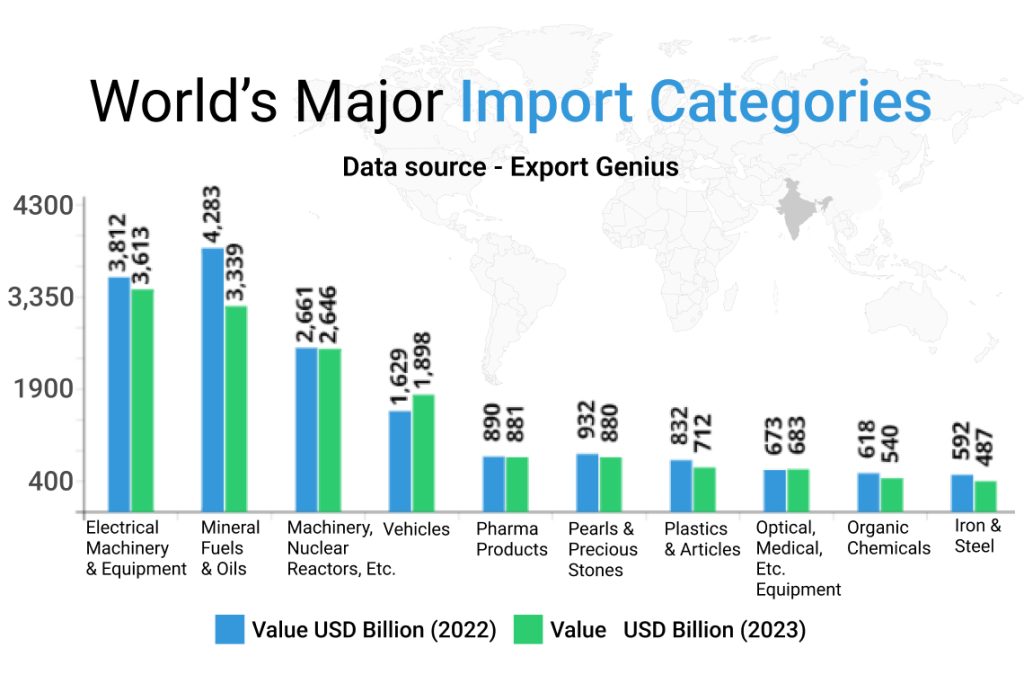
| Import Categories | Value USD Billion (2022) | Value USD Billion (2023) |
| Electrical Machinery and Equipment | 3,812 | 3,613 |
| Mineral Fuels and Oils | 4,283 | 3,339 |
| Machinery, Nuclear Reactors, Mechanical Appliances, etc. | 2,661 | 2,646 |
| Vehicles Other Than Railway or Tramway | 1,629 | 1,898 |
| Pharmaceutical Products | 890 | 881 |
| Pearls and Precious Stones | 932 | 880 |
| Plastics and Articles | 832 | 712 |
| Optical, Photographic, Medical, etc. Equipment | 673 | 683 |
| Organic Chemicals | 618 | 540 |
| Iron and Steel | 592 | 487 |
| Ores, Slag and Ash | 374 | 371 |
| Articles of Iron and Steel | 383 | 362 |
| Miscellaneous Chemical Products | 344 | 299 |
| Furniture, Bedding, Mattresses, etc. | 290 | 261 |
| Aluminium and Articles | 277 | 231 |
| Knitted or Crocheted Apparel and Clothing | 263 | 231 |
| Aircraft, Spacecraft, and Parts | 180 | 225 |
| Rubber and Articles | 237 | 220 |
| Not Knitted or Crocheted Apparel and Clothing | 229 | 215 |
| Copper and Articles | 232 | 209 |
World’s Major Export Categories
Global exports totaled USD 24.7 trillion in 2022, that dollar amount declined to USD 23.2 trillion in 2023.
The world’s major export categories include electrical machinery and equipment, mineral fuels and oils, machinery, mechanical appliances, nuclear reactors, etc., vehicles other than railway or tramway, pearls and precious stones, and pharmaceutical products.
See the top export categories in 2022 and 2023 with their values.
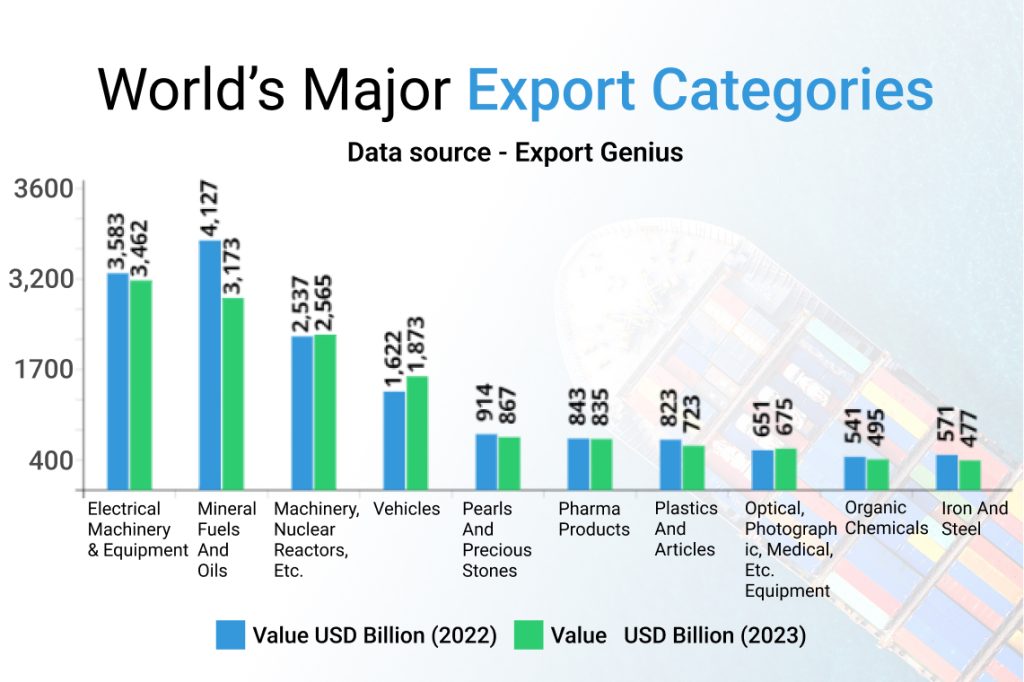
| Export Categories | Value USD Billion (2022) | Value USD Billion (2023) |
| Electrical Machinery and Equipment | 3,583 | 3,462 |
| Mineral Fuels and Oils | 4,127 | 3,173 |
| Machinery, Nuclear Reactors, Mechanical Appliances, etc. | 2,537 | 2,565 |
| Vehicles Other Than Railway or Tramway | 1,622 | 1,873 |
| Pearls and Precious Stones | 914 | 867 |
| Pharmaceutical Products | 843 | 835 |
| Plastics and Articles | 823 | 723 |
| Optical, Photographic, Medical, etc. Equipment | 651 | 675 |
| Organic Chemicals | 541 | 495 |
| Iron and Steel | 571 | 477 |
| Articles of Iron and Steel | 399 | 380 |
| Ores, Slag and Ash | 330 | 337 |
| Furniture, Bedding, Mattresses, etc. | 311 | 298 |
| Aircraft, Spacecraft, and Parts | 253 | 297 |
| Miscellaneous Chemical Products | 329 | 282 |
| Knitted or Crocheted Apparel and Clothing | 297 | 267 |
| Not Knitted or Crocheted Apparel and Clothing | 259 | 248 |
| Aluminium and Articles | 279 | 239 |
| Rubber and Articles | 220 | 216 |
| Copper and Articles | 218 | 206 |
World’s Top Import Countries
The United States of America and China are the top import countries in the world, followed by Germany, the United Kingdom, Japan, France, India, the Netherlands, and Hong Kong. Here is the list of top import countries with values reported in 2022 and 2023.
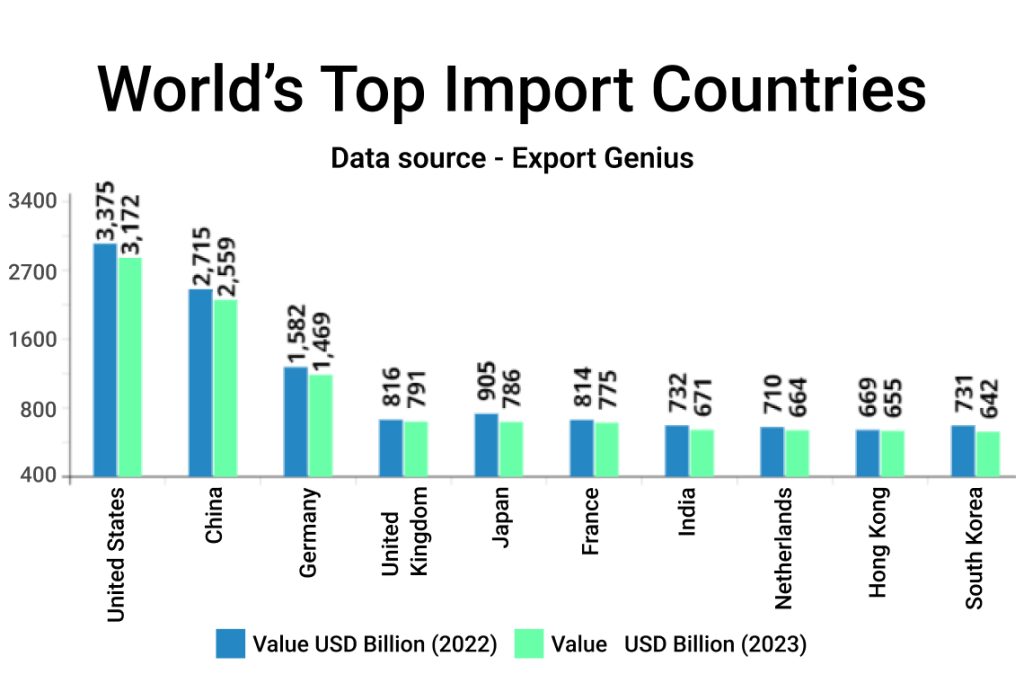
| Import Country | Value USD Billion (2022) | Value USD Billion (2023) |
| United States | 3,375 | 3,172 |
| China | 2,715 | 2,559 |
| Germany | 1,582 | 1,469 |
| United Kingdom | 816 | 791 |
| Japan | 905 | 786 |
| France | 814 | 775 |
| India | 732 | 671 |
| Netherlands | 710 | 664 |
| Hong Kong | 669 | 655 |
| South Korea | 731 | 642 |
| Italy | 695 | 639 |
| Mexico | 604 | 598 |
| Canada | 570 | 559 |
| Belgium | 624 | 550 |
| Spain | 499 | 469 |
| Singapore | 475 | 422 |
| Switzerland | 356 | 366 |
| Türkiye | 363 | 361 |
| Taipei, Chinese | 437 | 358 |
| Poland | 358 | 341 |
World’s Top Export Countries
China and the United States of America are the world’s biggest economies, followed by Germany, the Netherlands, Japan, Italy, France, South Korea, Mexico, Hong Kong, and Belgium. Here is the list of top export countries with values reported in 2022 and 2023.
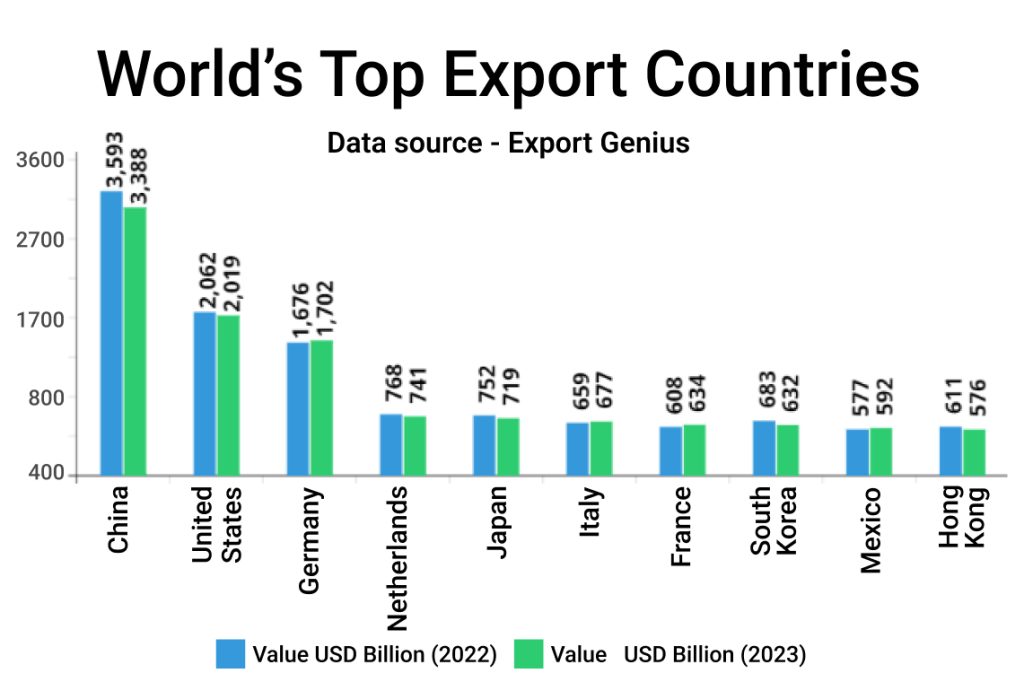
| Export Country | Value USD Billion (2022) | Value USD Billion (2023) |
| China | 3,593 | 3,388 |
| United States | 2,062 | 2,019 |
| Germany | 1,676 | 1,702 |
| Netherlands | 768 | 741 |
| Japan | 752 | 719 |
| Italy | 659 | 677 |
| France | 608 | 634 |
| South Korea | 683 | 632 |
| Mexico | 577 | 592 |
| Hong Kong | 611 | 576 |
| Belgium | 636 | 568 |
| Canada | 598 | 568 |
| United Kingdom | 530 | 519 |
| Singapore | 515 | 476 |
| Vietnam | 370 | 453 |
| Taipei, Chinese | 478 | 432 |
| India | 452 | 431 |
| Switzerland | 402 | 420 |
| Spain | 424 | 420 |
| Russia | 578 | 407 |
The trade profile of economies constantly evolves. Explore the global trade data at Export Genius to understand how the composition of exports and imports has been changing in different sectors and among trade partners over time.