US President Donald Trump acted on his campaign promises to “build that wall” and announced a raft of tariffs targeting countries worldwide, including some of America’s closest trading partners, in a move that risks sparking a ruinous trade war. Trump announced the most stinging import taxes, ranging from 10% to more than 49%, on what he called “Liberation Day.” Detailed data analysis of how much the US depends on imports from Asian countries, including India and China, and how new tariffs would impact global trade.
Find new US tariffs on 100 major countries, including Asia and the European Union, at the bottom of this article!


Global Recession Fear in 2025! Click and read more!
Overall, here are the likely consequences of Trump’s tariffs for the US economy
Deceleration in U.S. Economic Growth
Even if no country retaliates, these tariffs will throw heaps of sand in the wheels of global trade and slow overall economic growth everywhere. US trade data shows yearly trends of America’s exports and imports.
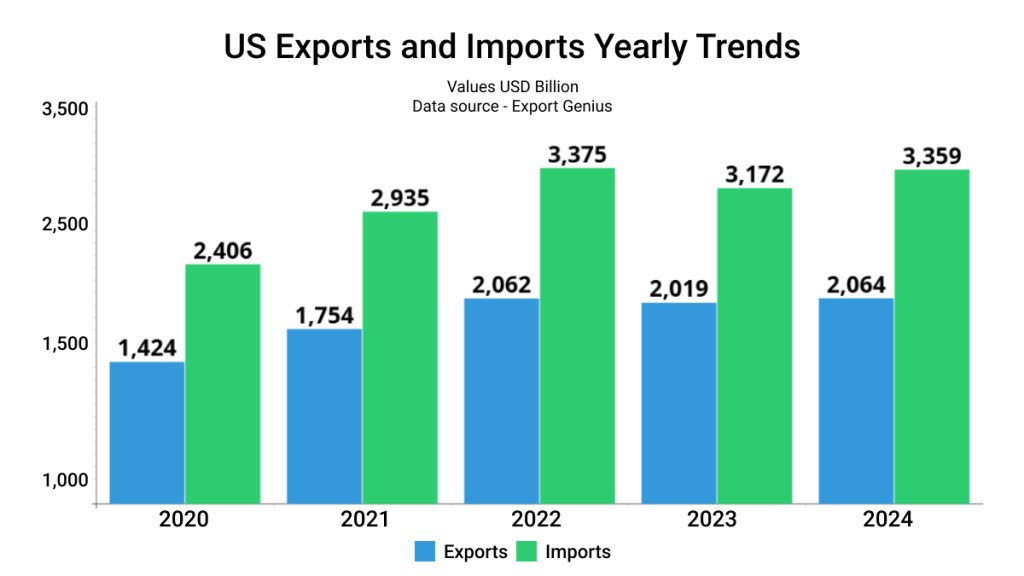
| Year | Exports (Value USD Billion) | Imports (Value USD Billion) |
| 2020 | 1,424 | 2,406 |
| 2021 | 1,754 | 2,935 |
| 2022 | 2,062 | 3,375 |
| 2023 | 2,019 | 3,172 |
| 2024 | 2,064 | 3,359 |
In the next few days, assuming no retaliation happens, stock markets will likely fall to reflect the lower profit outlook of companies and the lower growth prospects in the broader economy. If retaliations take place, then the growth outlook becomes even worse. Expect rating agencies to raise the probability of recession in the US.
- Rising Inflation Trends in the U.S.
There is only one way in which US citizens can escape inflation: if the value of the dollar relative to other currencies goes up by the degree to which the tariffs have been imposed. For instance, relative to India, if the dollar strengthens by 26% in a short period — that is, the rupee falls from 85 to a dollar to 108 to a dollar — then the US consumer will not feel the pinch of tariffs.
A US citizen will be able to import the same Indian goods at the same dollar price. The effect will be felt by Indians who would lose purchasing power as the rupee weakens against the dollar.
A weaker rupee means a higher cost of crude oil and higher domestic inflation in India.
If, however, the rupee remains at 85, then US citizens will have to face 26% higher prices for their imports from India. Similarly, all import prices will go up by the level of tariffs. This will unleash a huge wave of inflation in the US.
- Stagflation and Its Impact on Political Dynamics
If growth falters and inflation spikes, the US could face the worst of both worlds in the form of “stagflation” — a scenario where growth stagnates and inflation continues to remain high.
The high cost of living played an important part in the defeat of the Democrats in the November elections, and such a surge in prices could pose political problems for the Trump administration as well.
Strategies for Navigating Reciprocal US Tariffs on Commodities! Click and Read.
Trump Reciprocal Tariffs – Over 20% Tax on Asian Countries and 20% on the European Union
India is in the crosshairs of Donald Trump’s latest trade war move! The US slapped a 26% tariff on Indian commodities, part of a sweeping shake-up of global trade rules that ditches a system in place for over 75 years.
The rates aim to counter policies like currency manipulation, weak environmental and labor standards, and restrictive regulations that limit U.S. exports in foreign markets. The European Union faces a 20% U.S. tariff, while Vietnam gets hit with 45%, Japan with 24%, South Korea with 25%, India with 26%, Taiwan with 32%, and Thailand with 36%.
China, which recorded the largest 2024 trade surplus with the U.S. at $295 billion, will see a 34% tariff. Treasury Secretary Scott Bessent noted that when combined with Trump’s 20% February duties imposed over the U.S. fentanyl crisis—China’s total tariff rate rises to 54%. Trump had pledged a 60% tariff on Chinese goods during his 2024 campaign.
Meanwhile, Britain, Brazil, and Singapore, which ran trade deficits with the U.S. last year, have been spared higher rates and received only the baseline 10% tariff.
However, Russia—despite its $2.5 billion goods trade surplus with the U.S. in 2024, as per the U.S. Trade Representative’s office—was absent from Trump’s tariff list.
How much US imports from Asian countries? Look at US total imports from the world, Asia, and top Asian countries.
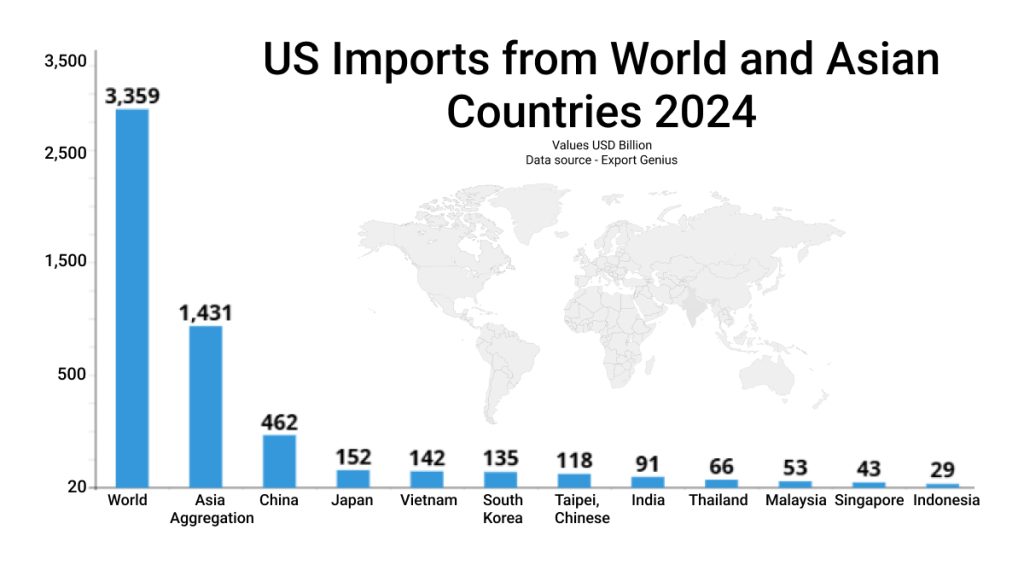
| Exporters | Value USD Billion |
| World | 3,359 |
| Asia Aggregation | 1,431 |
| China | 462 |
| Japan | 152 |
| Vietnam | 142 |
| South Korea | 135 |
| Taipei, Chinese | 118 |
| India | 91 |
| Thailand | 66 |
| Malaysia | 53 |
| Singapore | 43 |
| Indonesia | 29 |
After Asia, the European Union is the largest exporter partner of the United States. Data visualization of US imports from EU is given below:
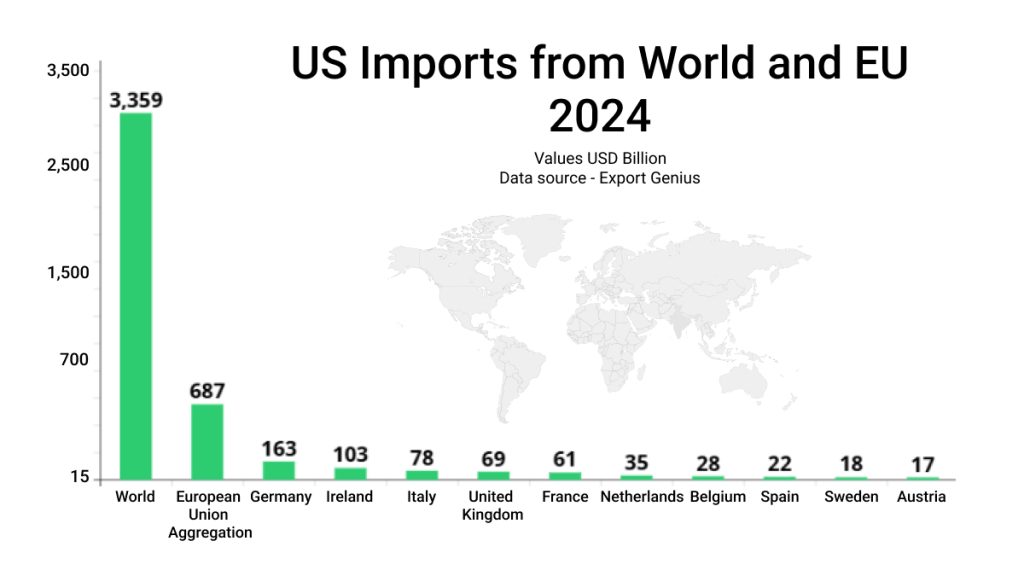
| Exporters | Value USD Billion |
| World | 3,359 |
| European Union Aggregation | 687 |
| Germany | 163 |
| Ireland | 103 |
| Italy | 78 |
| United Kingdom | 69 |
| France | 61 |
| Netherlands | 35 |
| Belgium | 28 |
| Spain | 22 |
| Sweden | 18 |
| Austria | 17 |
What about Canada and Mexico?
Goods from Canada and Mexico are currently exempt from reciprocal tariffs, as Trump’s earlier 25% fentanyl-related duties remain in place, along with a 10% tariff on Canadian energy and potash.
Mexico and Canada are the top exporter countries of the United States. In 2024, Mexico exported goods to the U.S. worth USD 509 billion and Canada shipped commodities to the US worth USD 422 billion.
High Inflation, Slower Growth, Elsewhere
The rest of the world too will slow down and face higher prices, depending on countries’ dependence on the US economy and their ability to find newer trading partners and supply chains.
What happens to the rest of the world now crucially depends on how Europe reacts. The US accounts for just 13% of the global trade while Europe accounts for almost 38%. If Europe can strengthen its ties with Asia (which accounts for almost 35% of global trade), then over the medium to long term the dependence on the US — which essentially is the biggest customer in the global market — can come down.
However, in the short term, the trade wars could lead to considerable economic pain across the world.
How should India navigate the torrent of Trump’s tariffs? Should India protect its domestic policy choices or use this outside pressure to bring domestic policies in line with what the US wants?
The Bottom Line
U.S. tariffs have far-reaching implications, extending well beyond the borders of the United States. They impact global supply chains, influence international trade dynamics, and affect economies of both developed and developing nations. Businesses face rising costs, consumers grapple with higher prices, and governments navigate complex diplomatic challenges.
As trade policies continue to evolve, understanding who is affected and how is crucial for stakeholders across the global economy. By examining these effects, we gain deeper insights into the interconnected nature of modern trade and the intricate web of global relations. Access crucial US trade data and import-export data of 180+ countries right at Export Genius with new features– Universal Search, Overview, and Custom Sorting added to the new dashboard.
Here Is The List Of New Tariff Rates on Major Countries
| S. No. | Country | New Tariff Rates |
| 1. | China | 34% |
| 2. | European Union | 20% |
| 3. | Vietnam | 46% |
| 4. | Taiwan | 32% |
| 5. | Japan | 24% |
| 6. | India | 26% |
| 7. | South Korea | 25% |
| 8. | Thailand | 36% |
| 9. | Switzerland | 31% |
| 10. | Indonesia | 32% |
| 11. | Malaysia | 24% |
| 12. | Cambodia | 49% |
| 13. | United Kingdom | 10% |
| 14. | South Africa | 30% |
| 15. | Brazil | 10% |
| 16. | Bangladesh | 37% |
| 17. | Singapore | 10% |
| 18. | Israel | 17% |
| 19. | Philippines | 17% |
| 20. | Chile | 10% |
| 21. | Australia | 10% |
| 22. | Pakistan | 29% |
| 23. | Turkey | 10% |
| 24. | Sri Lanka | 44% |
| 25. | Colombia | 10% |
| 26. | Peru | 10% |
| 27. | Nicaragua | 18% |
| 28. | Norway | 15% |
| 29. | Costa Rica | 10% |
| 30. | Jordan | 20% |
| 31. | Dominican Republic | 10% |
| 32. | United Arab Emirates | 10% |
| 33. | New Zealand | 10% |
| 34. | Argentina | 10% |
| 35. | Guatemala | 10% |
| 36. | Madagascar | 47% |
| 37. | Myanmar (Burma) | 44% |
| 38. | Tunisia | 28% |
| 39. | Kazakhstan | 27% |
| 40. | Serbia | 37% |
| 41. | Egypt | 10% |
| 42. | Saudi Arabia | 10% |
| 43. | El Salvador | 10% |
| 44. | Cote D Ivoire | 21% |
| 45. | Laos | 48% |
| 46. | Botswana | 37% |
| 47. | Trinidad and Tobago | 10% |
| 48. | Morocco | 10% |
| 49. | Algeria | 30% |
| 50. | Oman | 10% |
| 51. | Uruguay | 10% |
| 52. | Bahamas | 10% |
| 53. | Lesotho | 50% |
| 54. | Ukraine | 10% |
| 55. | Bahrain | 10% |
| 56. | Qatar | 10% |
| 57. | Mauritius | 40% |
| 58. | Fiji | 32% |
| 59. | Iceland | 10% |
| 60. | Kenya | 10% |
| 61. | Liechtenstein | 37% |
| 62. | Guyana | 38% |
| 63. | Haiti | 10% |
| 64. | Bosnia and Herzegovina | 35% |
| 65. | Nigeria | 14% |
| 66. | Namibia | 21% |
| 67. | Brunei | 24% |
| 68. | Bolivia | 10% |
| 69. | Panama | 10% |
| 70. | Venezuela | 15% |
| 71. | North Macedonia | 33% |
| 72. | Ethiopia | 10% |
| 73. | Ghana | 10% |
| 74. | Moldova | 31% |
| 75. | Angola | 32% |
| 76. | Democratic Republic of the Congo | 11% |
| 77. | Jamaica | 10% |
| 78. | Mozambique | 16% |
| 79. | Paraguay | 10% |
| 80. | Zambia | 17% |
| 81. | Lebanon | 10% |
| 82. | Tanzania | 10% |
| 83. | Iraq | 39% |
| 84. | Georgia | 10% |
| 85. | Senegal | 10% |
| 86. | Azerbaijan | 10% |
| 87. | Cameroon | 11% |
| 88. | Uganda | 10% |
| 89. | Albania | 10% |
| 90. | Armenia | 10% |
| 91. | Neall | 10% |
| 92. | Sint Maarten | 10% |
| 93. | Falkland Islands | 41% |
| 94. | Gabon | 10% |
| 95. | Kuwait | 10% |
| 96. | Togo | 10% |
| 97. | Suriname | 10% |
| 98. | Belize | 10% |
| 99. | Papua New Guinea | 10% |
| 100. | Malawi | 17% |