It’s all over the news now: safety concerns for shipping vessels in the Red Sea, drought in the Panama Canal, and economic uncertainty worldwide. This is a perfect storm for substantial and far-reaching supply chain disruption. While the automotive, electrical, and lighting industries have undergone tumultuous times since the global pandemic, this unfolding drama is likely to prove even more volatile.
The Suez Canal, a critical waterway connecting the Mediterranean Sea to the Red Sea, handled approximately 12% to 15% of global trade 2023. According to the United Nations Trade and Development, the estimated trade volume going through the Suez Canal declined by 42% over the last two months.


The ongoing conflict in Ukraine triggered substantial shifts in oil and grain trades, so the Panama Canal worsened things due to severe drought conditions. That has diminished water levels, resulting in a staggering 26% reduction in total transits over the past month compared to a year ago.
The long-term implications of climate change on the canal’s capacity raise concerns about enduring impacts on global supply chains. The crisis in the Red Sea, marked by Houthi-led attacks disrupting shipping routes, has added another layer of complexity.
Shipping costs are rising again
In response to the Red Sea crisis, major players in the shipping industry have suspended Suez transits. Meanwhile, shipping prices are increasing. The $500 surge in the average container spot freight rates during the last week of December was the highest-ever weekly increase. Here’s a look at global trade from 2019 to 2023.
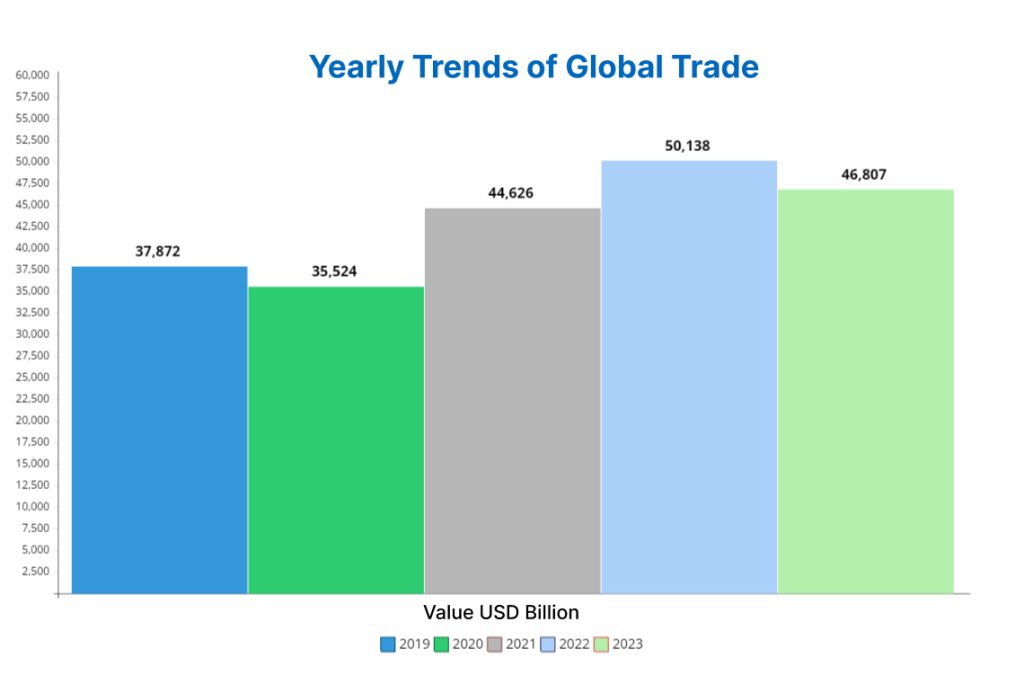
| Year | Exports (Value USD Billion) | Imports (Value USD Billion) | Total Trade (Value USD Billion) |
| 2019 | 18,768 | 19,104 | 37,872 |
| 2020 | 17,521 | 17,733 | 35,524 |
| 2021 | 22,158 | 22,468 | 44,626 |
| 2022 | 24,721 | 25,417 | 50,138 |
| 2023 | 23,266 | 23,541 | 46,807 |
Trouble in Central America
International trade is also being hampered by low water levels in the Panama Canal. That means the waterway cannot be fully utilized. As a result, the United States shippers have had to integrate their sea routes with East Asia. They must transport goods across the U.S. by rail or road from West Coast ports to those on the US East Coast.
Shipping bulk commodities like wheat and liquified natural gas (LNG) across the United States is economically unviable. This leaves shippers with no alternative to the very long and dangerous route around Cape Horn on the southern tip of South America. US exports of both wheat and LNG declined in 2023 as compared to the previous year. Here’s US export data of wheat and LNG with graphics.
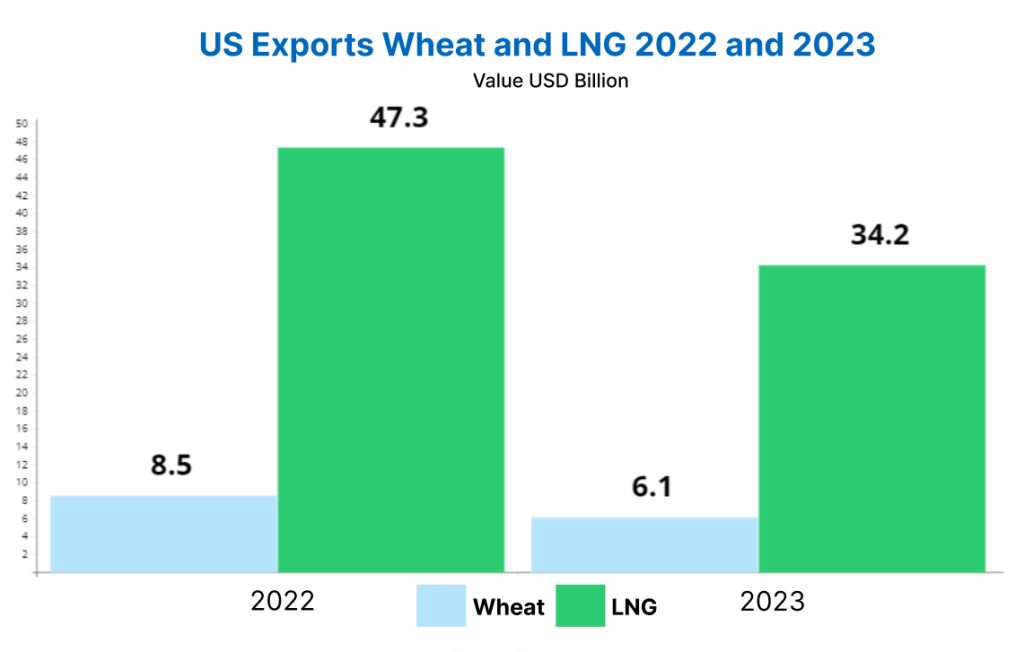
| Commodity | 2022 (Value USD Billion) | 2023 (Value USD Billion) |
| Wheat | 8.5 | 6.1 |
| LNG | 47.3 | 34.2 |
U.S. trade in goods
The United States has been recording an increase in total imports that puts a burden on the country’s trade balance. In fact, the U.S. reported a record trade gap between exports and imports in the first five months of 2024. Here is a data visualization of America’s trade of commodities from Jan to May 2024.
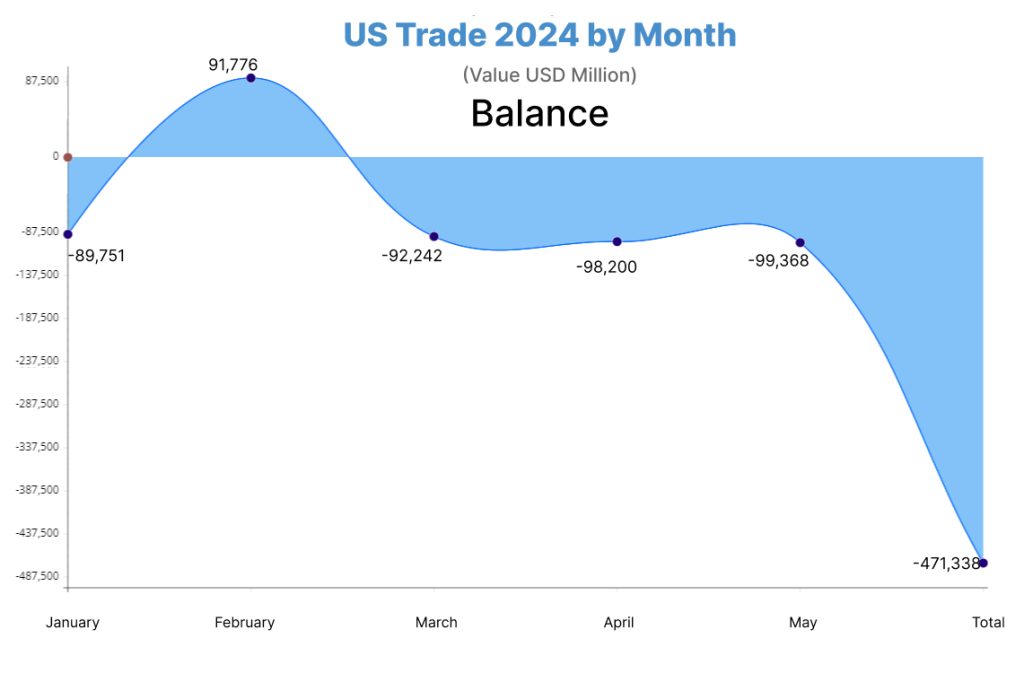
| Month | Exports (Value USD Million) | Imports (Value USD Million) | Balance (Value USD Million) |
| January | 168,924 | 258,675 | -89,751 |
| February | 174,130 | 265,906 | 91,776 |
| March | 169,064 | 261,306 | -92,242 |
| April | 171,105 | 269,306 | -98,200 |
| May | 168,045 | 267,414 | -99,368 |
| Total | 851,271 | 1,322,609 | -471,338 |
In 2023 too, the United States recorded a fluctuation in imports and exports with the trade deficit. With US trade data, get a glimpse of the country’s trade balance that will help you understand the market.
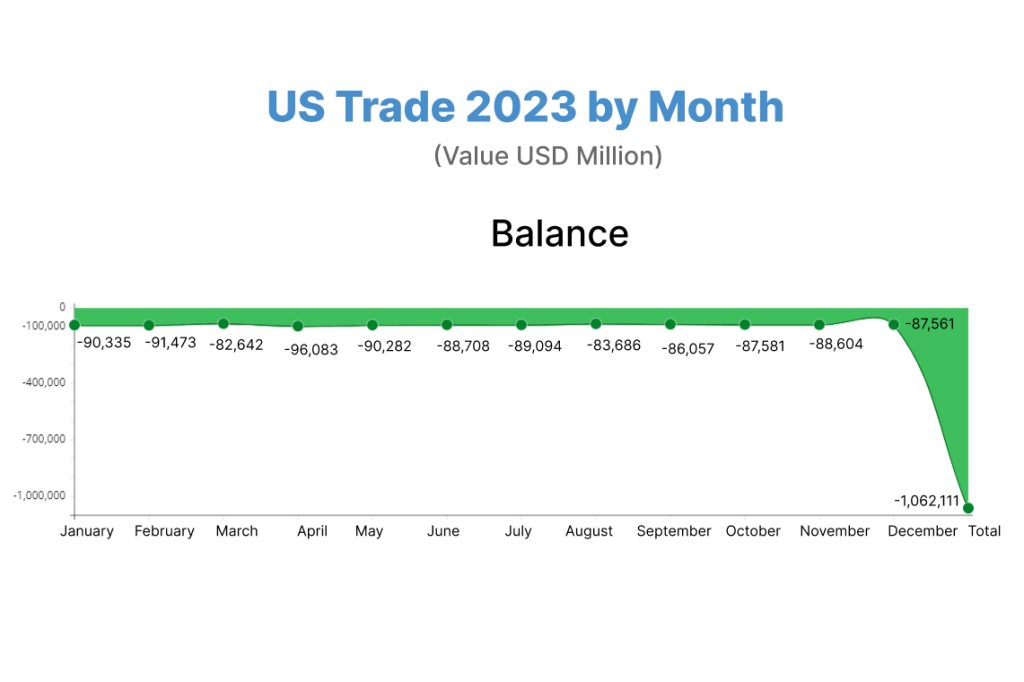
| Month | Exports (Value USD Million) | Imports (Value USD Million) | Balance (Value USD Million) |
| January | 173,689 | 264,024 | -90,335 |
| February | 168,373 | 259,847 | -91,473 |
| March | 171,065 | 253,708 | -82,642 |
| April | 163,564 | 259,648 | -96,083 |
| May | 162,725 | 253,008 | -90,282 |
| June | 163,009 | 251,718 | -88,708 |
| July | 165,609 | 254,703 | -89,094 |
| August | 170,141 | 253,827 | -83,686 |
| September | 172,340 | 258,398 | -86,057 |
| October | 171,183 | 258,764 | -87,581 |
| November | 166,199 | 254,803 | -88,604 |
| December | 170,156 | 257,717 | -87,561 |
| Total | 2,018,059 | 3,080,170 | -1,062,111 |
In short, the trickle-down effect of the Red Sea, and Panama Canal challenges:
- Increased global freight costs
- Delayed deliveries and longer voyage durations
- Tighter supplies
The bottom line
Global trade has followed a highly volatile pattern since the onset of the Covid-19 pandemic. Both economic and non-economic disruptions have had significant effects on global trade since 2020. Now Red Sea attacks and the Panama Canal crisis have made it difficult for shipments to reach their destinations on time. Many countries have changed their routes or ways to move their consignments across international borders. Get all the latest updates on global trade developments by accessing complete and essential import-export data right from Export Genius, a global leader in market research.